

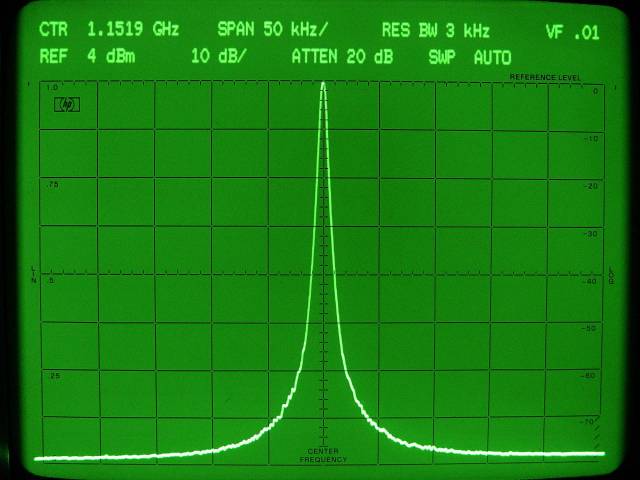
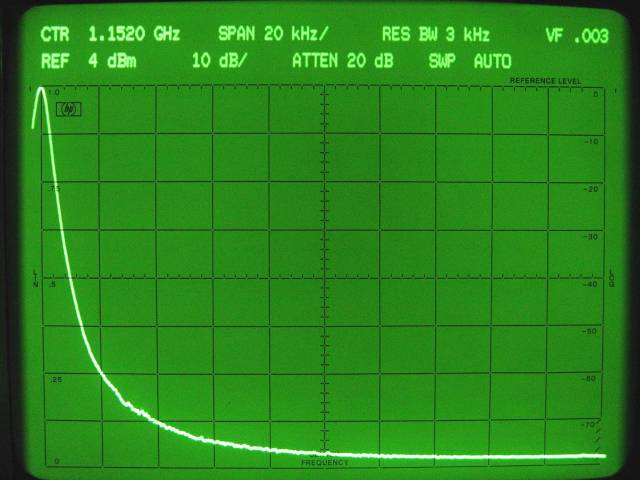
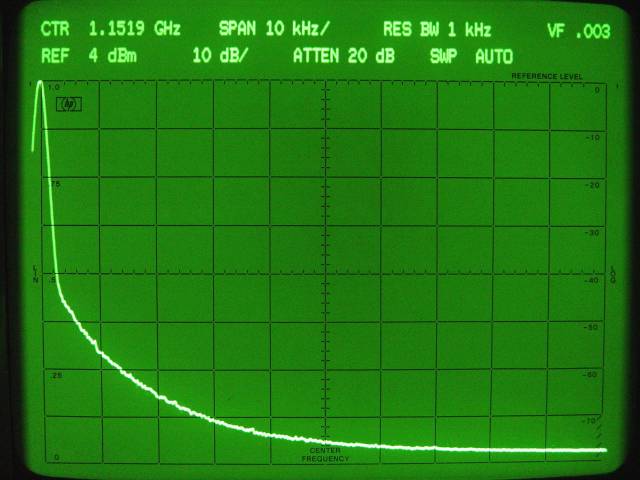
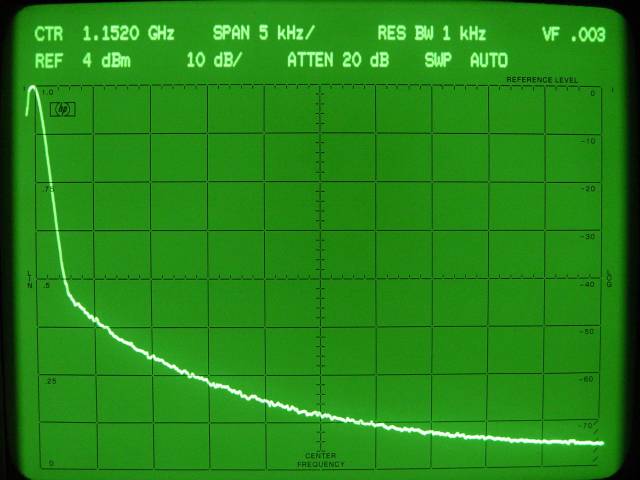
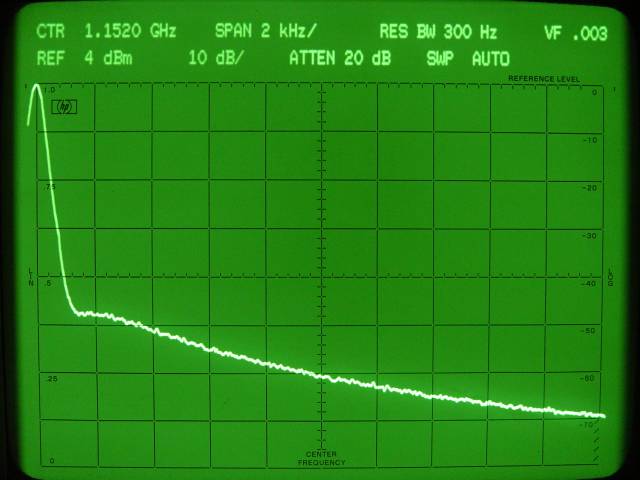
Updated: 11/09/2003 The following Model 1152 Phase Noise images were taken using an HP 8569B Spectrum Analyzer. The final Phase Noise readings are based on the relationship that the display reading is adjusted for the Resolution Bandwidth of the Spectrum Analyzer. For example, when measuring using a resolution bandwidth of 1KHz, the correction to the display data is 10Log(ResBW) or 10Log(1000) which equal 30dB. So a value of -30 dB is added to the displayed results to achieve the final phase noise value. For a resolution bandwidth of 3KHz the correction is -35 dB and for 300Hz resolution bandwidth the correction is -25 dB. The resolution bandwidth for each measurement is displayed on the CRT image. In the 50KHz and 20KHz display images you will observe that the 200KHz Reference Spurs are not detectable on the analyzer. This is due to the loop filter bandwidth being designed for 5KHz. This filter bandwidth means that the loop will achieve a lock time of approximately 940 uSecs, plenty fast enough for a fixed frequency PLL application like a Transverter Local Oscillator.
 |
|